Iklan
Anda akan mendapati bahwa peningkatan ke unit memasak yang terhubung menjadi pilihan yang wajib dipertimbangkan. seiring dengan pergeseran gaya hidup terhubung dari hal baru menjadi harapan di rumah tangga AS.
Pasar global bergerak cepat: USD 317,2 juta pada tahun 2024, diperkirakan mencapai 350,3 juta pada tahun 2025 dan diproyeksikan mencapai 918,2 juta pada tahun 2034 dengan CAGR 11,31% pada tahun 2033. Pertumbuhan ini menunjukkan bahwa kategori ini sekarang melayani konsumen biasa, bukan hanya pembeli teknologi pemula.
Anda akan mempelajari ukuran pasar, dinamika pangsa pasar, tren teknologi, segmen produk, penetapan harga, dan apa artinya ini bagi pilihan dapur Anda.
Janji intinya sederhana: Konektivitas plus otomatisasi yang sesuai dengan jadwal, kebiasaan makan, dan rutinitas Anda untuk menghasilkan masakan yang lebih konsisten, pengawasan yang lebih sedikit, dan kesalahan sehari-hari yang lebih sedikit.
Panduan bergaya laporan ini menggunakan data terkini dan contoh merek nyata—Samsung, LG, Bosch, GE—untuk memastikan temuan tetap relevan dan bermanfaat bagi keputusan Anda.
Iklan
Gambaran pasar oven pintar untuk dapur terhubung masa kini.
Dapur pintar masa kini didukung oleh momentum pasar yang jelas dan permintaan konsumen yang terus meningkat. Kategori dapur pintar global diperkirakan mencapai... USD 317,2 juta pada tahun 2024 dan diproyeksikan mencapai USD 918,2 juta pada tahun 2034 dengan CAGR sebesar 11,3%.
Ukuran dan pertumbuhan pasar global hingga tahun 2034
Tren pertumbuhan ini menunjukkan peningkatan ketersediaan produk secara bertahap: tingkat pertumbuhan tahunan majemuk (CAGR) dua digit menandakan peningkatan ketersediaan produk dan penurunan harga selama periode perkiraan. Pergeseran ini mengubah fitur-fitur awal menjadi ekspektasi umum.
Apa arti "pintar" sekarang?
Fungsionalitas lebih penting daripada jargon-jargon pemasaran. Fitur-fitur unggulannya meliputi kontrol Wi-Fi dan aplikasi, integrasi perintah suara, dan pemantauan jarak jauh untuk status dan peringatan. Kemampuan ini mengubah perangkat dari peralatan pasif menjadi penolong aktif dalam rutinitas Anda.
Iklan
Mengapa hal ini penting bagi rumah Anda
Gunakan data pasar untuk menentukan waktu yang tepat: Beli sekarang jika Anda membutuhkan kemudahan dan panduan memasak, atau tunggu hingga interoperabilitas lebih luas dan biaya lebih rendah. Bagian selanjutnya dari laporan ini akan menguraikan jenis produk, teknologi memasak, distribusi, dan total biaya kepemilikan sehingga Anda dapat memilih dengan percaya diri.
Mengapa momentum rumah pintar mempercepat permintaan oven pintar?
Meningkatnya pengeluaran per rumah tangga untuk teknologi rumah tangga jelas merupakan pendorong di balik meningkatnya permintaan akan peralatan dapur yang terhubung. Saat Anda menambahkan ekosistem, anggaran perangkat Anda biasanya akan melebar. Pergeseran itu mendorong peningkatan perangkat lebih cepat dari yang Anda duga.
Tren pengeluaran perangkat rumah pintar membentuk peningkatan peralatan rumah tangga.
Saat ini, warga Amerika menghabiskan sekitar... USD 3.026 pada perangkat secara rata-rata, ditambah kira-kira USD 498 setahun untuk perawatan. Banyak yang berencana menghabiskan sekitar... USD 896 tentang teknologi rumah di tahun 2025.
| Metrik | Saat ini (USD) | Biaya Pemeliharaan Tahunan (USD) | Pengeluaran yang direncanakan untuk tahun 2025 (USD) |
|---|---|---|---|
| Rata-rata pengeluaran per rumah tangga untuk perangkat elektronik. | 3,026 | 498 | 896 |
| Pemicu peningkatan standar | Komitmen platform | Pembaruan perangkat lunak | Integrasi baru |
| Motif utama pembeli | Kenyamanan | Keandalan | Interoperabilitas |
Bagaimana ekosistem IoT memengaruhi siklus pembelian dan peningkatan
Anda cenderung lebih menyukai perangkat yang kompatibel dengan platform pilihan Anda. Dukungan asisten suara, aplikasi terpadu, rutinitas bersama, dan peringatan lintas perangkat menciptakan daya tarik ekosistem yang kuat.
Dorongan ini meningkatkan ekspektasi: otomatisasi yang lebih baik, pengaturan yang lebih cepat, dan keandalan yang lebih tinggi. Untuk memasak, itu berarti Anda menghargai peringatan dan kendali jarak jauh. Manfaat-manfaat tersebut menjelaskan mengapa tren pasar menunjukkan pertumbuhan yang stabil dalam permintaan oven pintar yang didorong oleh perilaku konsumen dan penelitian.
Adopsi oven pintar: apa yang mendorongnya di rumah-rumah modern AS?
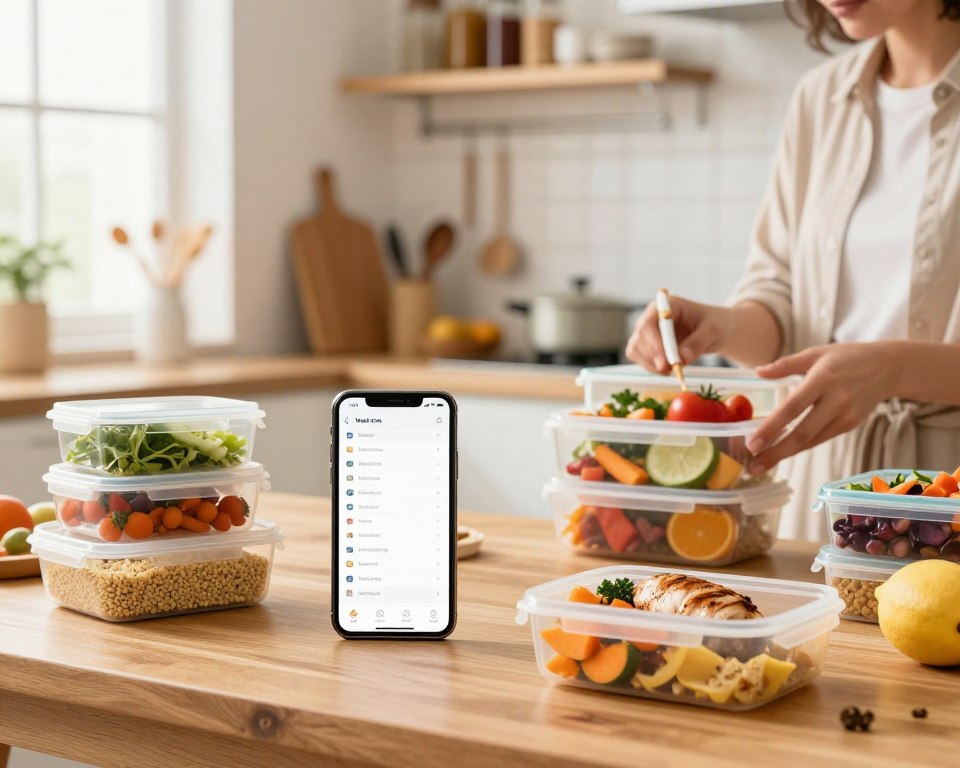
Di banyak rumah di AS, peralatan masak yang terhubung dipilih karena menghemat waktu sehari-hari dan mengurangi kejadian tak terduga di dapur. Kenyamanan dan otomatisasi memungkinkan Anda memanaskan terlebih dahulu saat dalam perjalanan, mendapatkan notifikasi saat makan malam selesai, dan mengikuti program terpandu yang mengurangi kesalahan.
Kemudahan dan otomatisasi untuk jadwal yang padat
Otomatisasi Mengurangi pengecekan rutin dan membuat masakan Anda lebih mudah diprediksi. Pengatur waktu, mulai dari jarak jauh, dan resep multi-langkah memungkinkan Anda mengatur waktu makan di sela-sela pekerjaan, mengantar anak ke sekolah, dan menjalankan tugas-tugas lainnya.
Efisiensi energi, keberlanjutan, dan pengurangan limbah
Kontrol yang presisi dan manajemen panas yang lebih baik meningkatkan efisiensi. Hal ini menghemat energi dan mengurangi pemborosan makanan dengan menghindari pemasakan berlebihan. Konsumen yang ingin menurunkan tagihan akan menganggap ini sebagai manfaat praktis yang jelas.
Mode memasak yang berfokus pada kesehatan
Mode menggoreng dengan udara panas, mengukus, dan memanggang kini menjadi penting. Fitur-fitur ini memungkinkan hidangan rendah lemak dan tekstur yang lebih baik tanpa peralatan tambahan, sehingga memasak yang lebih sehat menjadi kebiasaan rutin.
Kontrol dan pemantauan jarak jauh melalui aplikasi ponsel pintar.
Kontrol melalui aplikasi mengubah rutinitas Anda: Anda dapat memeriksa kemajuan, menyesuaikan pengaturan, dan menghentikan proses memasak dari mana saja. Saat membandingkan peralatan dapur, prioritaskan sensor, program memasak multifungsi, aplikasi yang andal, dan dukungan berkelanjutan.
Prospek pasar AS dan dinamika pangsa pasar Amerika Utara
Kepemimpinan pendapatan AS membentuk kembali peluncuran produk dan fokus ritel di seluruh Amerika Utara. Dengan pangsa pasar regional sekitar 77% dan pendapatan sekitar USD 83,5 juta (2024), AS menjadi tempat uji coba utama untuk fitur dan penetapan harga baru.
Konsentrasi tersebut berarti Anda mendapatkan lebih banyak pilihan perangkat, pembaruan firmware yang lebih cepat, dan persaingan harga yang lebih ketat. Merek-merek memprioritaskan saluran ritel AS, pemasang instalasi, dan kemitraan platform karena ukuran pasar membenarkan investasi tersebut.
Bangunan baru vs. renovasi
Pembangunan rumah pintar baru seringkali mencakup pengkabelan, jangkauan Wi-Fi yang lebih baik, dan koneksi siap pakai untuk dapur. Pemasangan ulang berfokus pada kompatibilitas dan jalur instalasi yang mudah.
Di mana rumah tangga Anda berada
Gunakan data ini untuk membandingkan diri Anda: sekitar 63,43 juta rumah di AS (~451.300.000) sudah memiliki perangkat, dan 7 dari 10 pembeli mencari rumah pintar. Jika Anda memiliki termostat, kamera, atau speaker, perangkat dapur biasanya akan menyusul.
“Pangsa pasar AS yang lebih besar mendorong ketersediaan dan inovasi yang lebih cepat bagi konsumen.”
Ramalan Catatan: kategori ini terus berkembang, tetapi nilai terbaik Anda didapatkan dengan mencocokkan fitur dengan ekosistem dan kebiasaan memasak sehari-hari Anda. Lakukan pengecekan kecocokan cepat: jika Anda sudah menggunakan perangkat yang terhubung, kemungkinan Anda termasuk dalam mayoritas awal; jika tidak, menunggu dapat berarti harga yang lebih rendah dan standar yang lebih jelas.
Kesenjangan digital di AS dalam adopsi rumah pintar dan apa artinya bagi Anda
Lokasi tempat tinggal Anda memengaruhi seberapa cepat perangkat rumah pintar menjadi umum dalam kehidupan sehari-hari.
Negara bagian dengan tingkat adopsi tinggi menunjukkan keunggulan yang jelas. Connecticut (28,21 TP3T), Utah (27,81 TP3T), dan Maryland (27,61 TP3T) memimpin di negara ini. Tempat-tempat dengan penetrasi lebih rendah seperti Alaska (131 TP3T), Mississippi, dan Wyoming (keduanya di bawah 161 TP3T) jauh tertinggal.
Negara bagian dengan tingkat adopsi tinggi vs. negara bagian dengan penetrasi rendah.
Mengapa hal ini penting: Tarif yang lebih tinggi biasanya berkaitan dengan koneksi internet yang lebih baik dan pendapatan rumah tangga yang lebih tinggi. Kombinasi tersebut membuat fitur jarak jauh terasa andal dan sepadan dengan biaya tambahannya.
Konektivitas, pendapatan, dan hambatan pembelian
Jika Wi-Fi Anda tidak stabil, kontrol aplikasi dan pemantauan jarak jauh tidak lagi memberikan manfaat. Konsumen di daerah dengan konektivitas rendah menghadapi lebih banyak masalah pengaturan, yang mengurangi permintaan dan memperlambat pertumbuhan pasar.
| Kelompok Negara | Contoh Negara Bagian | Tingkat Adopsi | Konektivitas & Pendapatan |
|---|---|---|---|
| Tinggi | Connecticut, Utah, Maryland | ~27–28% | Koneksi internet broadband yang kuat, pendapatan median yang lebih tinggi. |
| Rendah | Alaska, Mississippi, Wyoming | 13–16% | Cakupan yang lebih lemah, pendapatan median yang lebih rendah |
Implikasi bagi pengecer, pemasang, dan Anda
Peritel menyimpan lebih banyak unit dan menawarkan demo di tempat-tempat dengan permintaan tinggi. Pemasang juga berkumpul di wilayah-wilayah tersebut. Di daerah dengan penetrasi yang lebih rendah, Anda mungkin menemukan lebih sedikit demo, dukungan terbatas, dan komunitas riset lokal yang lebih kecil.
Poin penting yang perlu diingat: Periksa konektivitas rumah Anda dan dukungan lokal sebelum membayar lebih untuk fitur-fitur terhubung. Jika cakupan atau teknisi instalasi terbatas, model standar seringkali memberikan nilai yang lebih baik.
Ukuran pasar, asumsi periode perkiraan, dan CAGR yang perlu Anda ketahui.
Prakiraan numerik yang jelas memberikan sinyal praktis tentang harga, peluncuran fitur, dan waktu peningkatan. Gunakan angka-angka tersebut untuk memutuskan apakah Anda membutuhkan utilitas segera atau dapat menunggu harga yang lebih rendah dan kompatibilitas yang lebih luas.
Menginterpretasikan CAGR dan periode perkiraan
Penjelasan CAGR: CAGR 11,3% (2025–2034) berarti kategori ini tumbuh stabil setiap tahun, dan terus meningkat seiring waktu. Hal ini membantu Anda menerjemahkan berita utama menjadi ekspektasi yang realistis.
Periode perkiraan Perencanaan kerangka kerja: perusahaan menggunakannya untuk membuat peta jalan fitur, pengecer untuk mengisi persediaan, dan pembeli untuk menentukan waktu pemberian diskon.
Variabel-variabel kunci yang dapat mengubah perkiraan
Beberapa faktor memengaruhi ukuran pasar dan perkiraan pertumbuhannya:
- Penetapan harga komponen dan rantai pasokan.
- Peluncuran fitur dan seberapa cepat model kelas menengah meniru teknologi premium.
- Kontrol privasi dan keamanan yang mendorong kepercayaan konsumen.
- Kemitraan platform dan dukungan perangkat lunak.
| Variabel | Dampak pada ukuran | Tanda jangka pendek | Aksi untuk Anda |
|---|---|---|---|
| Biaya komponen | Dapat menaikkan harga eceran | Kenaikan harga, persediaan terbatas | Beli jika mendesak; jika tidak, tunggu saja. |
| Fitur baru | Penetapan harga premium sementara | Peluncuran produk premium kemudian secara bertahap menyusul ke produk yang lebih murah. | Pertahankan untuk nilai menengah |
| Privasi & keamanan | Meningkatkan kepercayaan konsumen dan pertumbuhan | Peningkatan penggunaan produk yang aman. | Lebih suka perangkat dengan kontrol yang jelas. |
Daftar periksa singkat untuk membaca analisis pasar
Daftar periksa: Periksa tanggal periode perkiraan, verifikasi perhitungan CAGR, perhatikan ukuran pasar tahun dasar (USD 350,3 juta pada tahun 2025), dan tanyakan variabel apa saja yang disertakan oleh analis. Hal itu akan mencegah Anda disesatkan oleh angka-angka besar.
Tren teknologi yang membentuk kembali kategori oven pintar
Lapisan kontrol baru dan algoritma pembelajaran mengubah cara dapur Anda menangani makanan rutin.
AI dan pembelajaran mesin Kini hadir fitur memasak terpandu, prediksi tingkat kematangan, dan penyesuaian suhu otomatis yang mengurangi tebakan. Bosch Series 8 adalah contoh konkretnya: fitur memasak dengan sensor menggunakan pembelajaran mesin (ML) untuk menyempurnakan pengaturan waktu dan panas berdasarkan data nyata, sehingga hasilnya akan semakin baik seiring semakin sering digunakan.
Suara, sensor, dan kontrol presisi
Asisten suara dan kontrol presisi memang membantu, tetapi tidak semua fitur sama pentingnya. Suara sangat bagus untuk perintah tanpa menggunakan tangan dan pengecekan cepat. Sensor berkualitas tinggi dan kontrol pengesampingan manual adalah nilai sebenarnya untuk hasil memasak yang konsisten.
Standar konektivitas: Wi-Fi vs Bluetooth vs NFC
| Standar | Jangkauan & Keandalan | Penggunaan terbaik |
|---|---|---|
| Wi-Fi | Jangkauan luas, stabil untuk kontrol aplikasi. | Pemantauan dan pembaruan jarak jauh |
| Bluetooth | Jangkauan lebih pendek, daya lebih rendah | Pemasangan lokal dan pengaturan cepat |
| NFC | Jangkauan sangat pendek, otentikasi sederhana | Pemasangan dan demo yang aman |
Interoperabilitas dan nilai jangka panjang
Periksa apakah perangkat Anda kompatibel dengan rutinitas rumah pintar yang sudah ada. Kualitas aplikasi, pembaruan firmware, dan dukungan platform menentukan apakah fitur konektivitas tetap bermanfaat seiring waktu.
Tips evaluasi: Uji akurasi sensor, pastikan Anda dapat menimpa pengaturan otomatis, dan tanyakan apakah fitur pembelajaran benar-benar meningkatkan kualitas masakan Anda. Hal itu membantu Anda memilih teknologi dan fitur yang penting untuk rutinitas harian Anda.
Segmentasi jenis produk: oven tanam, oven di atas meja, dan oven berdiri bebas
Tata letak dan rutinitas dapur Anda harus menjadi panduan untuk memilih segmen produk yang paling sesuai. Setiap jenis produk mengubah cara pemasangan, biaya, dan cara Anda menggunakan perangkat tersebut setiap hari.
Unit terintegrasi yang menghasilkan pendapatan utama dan efek desain modern.
Unit built-in memimpin pasar pada tahun 2024 dengan pendapatan sebesar USD 207,9 juta. dan diperkirakan akan tumbuh sekitar 11,51 TP3T CAGR. Produk-produk ini menarik bagi rumah tangga perkotaan yang menghargai desain dapur yang mulus dan peralatan terintegrasi.
Lemari built-in menghemat ruang di meja dapur dan memberikan tampilan premium. Lemari ini sering dipadukan dengan kabinet dan cocok dengan perlengkapan kelas atas lainnya.
Solusi penambahan ruang pada meja dapur untuk rumah tangga kecil dan dapur dengan ruang terbatas.
Model meja dapur juga mengalami pertumbuhan yang kuat, dengan CAGR yang diperkirakan mendekati 11,11 TP3T selama periode perkiraan. Penyewa, pemilik rumah mungil, dan keluarga kecil memilihnya karena fleksibilitasnya.
Perangkat ini tidak memerlukan renovasi, cocok untuk ruang sempit, dan menghadirkan mode memasak canggih tanpa memakan banyak tempat.
Unit berdiri sendiri sebagai jalur tengah yang fleksibel.
Produk berdiri bebas menawarkan kapasitas ukuran penuh tanpa instalasi terintegrasi. Produk ini merupakan jalan tengah bagi orang-orang yang menginginkan volume memasak besar dan pengaturan yang lebih mudah.
Unit-unit ini sangat cocok jika Anda berencana memasak dalam jumlah besar atau mengadakan acara kumpul-kumpul sesekali tetapi tidak ingin mengeluarkan biaya untuk lemari khusus.
“Sesuaikan jenis produk dengan gaya hidup Anda — bukan hanya dengan tren terbaru.”
Apa yang perlu dibandingkan antar segmen:
- Fitur konektivitas dan dukungan aplikasi untuk kendali jarak jauh yang andal.
- Kapasitas internal dan apakah Anda membutuhkan ruang memasak tunggal atau yang lebih besar.
- Mode memasak seperti menggoreng dengan udara panas dan mengukus yang sesuai dengan rencana makan Anda.
- Ketersediaan layanan jangka panjang dan cakupan garansi di wilayah Anda.
Panduan pengambilan keputusan cepat: Pilih model built-in untuk desain terintegrasi dan nilai jual kembali, model countertop untuk keterbatasan ruang dan fleksibilitas sewa, dan model freestanding untuk memasak ukuran penuh dengan pemasangan yang lebih mudah. Fokuslah pada bagaimana produk tersebut sesuai dengan pola makan Anda daripada mengejar setiap fitur baru.
Konfigurasi dan kapasitas: memilih oven tunggal vs oven ganda untuk rumah Anda
Memilih konfigurasi yang tepat bergantung pada bagaimana Anda memasak, bukan hanya seberapa banyak ruang yang Anda miliki.
Tunggal vs ganda: sesuaikan dengan rutinitas Anda
Unit tunggal cocok untuk sebagian besar rumah tangga. Jika Anda memasak makanan untuk makan malam di hari kerja, sesekali memanggang, dan ruang terbatas, satu ruang oven akan menyederhanakan semuanya.
Konfigurasi ganda cocok untuk mereka yang sering mengadakan pesta dan keluarga besar. Dua rongga memungkinkan Anda menjalankan suhu berbeda secara bersamaan dan mengurangi stres pengaturan waktu untuk hidangan saat liburan.
Tingkat kapasitas dan kesesuaian praktis
Tingkat kapasitas yang umum digunakan di pasaran: 20–25L, 26–30L, dan di atas 30L. Produk yang diletakkan di atas meja biasanya berada dalam kisaran 20–30L. Model ukuran penuh yang terpasang permanen atau berdiri sendiri biasanya melebihi 30L.
| Tingkat | Volume (L) | Terbaik untuk | Catatan praktis |
|---|---|---|---|
| Kompak | 20–25 | Koki tunggal, rumah kecil | Menghemat ruang; penggunaan multi-rak terbatas. |
| Pertengahan | 26–30 | Keluarga kecil, persiapan makanan | Menyeimbangkan fleksibilitas dan ukuran |
| Besar | >30 | Menghibur, dalam jumlah besar | Performa multi-rak yang lebih baik |
Daftar periksa praktis
- Catat ukuran loyang yang Anda gunakan dan volume adonan yang biasa Anda buat.
- Tentukan apakah dua rongga independen sesuai dengan frekuensi pemasangan Anda.
- Sesuaikan pilihan kapasitas dengan peralatan lain agar dapur berfungsi sebagai sebuah sistem.
Tips terakhir: Hindari membeli kapasitas yang berlebihan yang tidak akan Anda gunakan, tetapi pilihlah ukuran yang dapat berkembang seiring pertumbuhan rumah tangga Anda untuk memenuhi kebutuhan di masa mendatang.
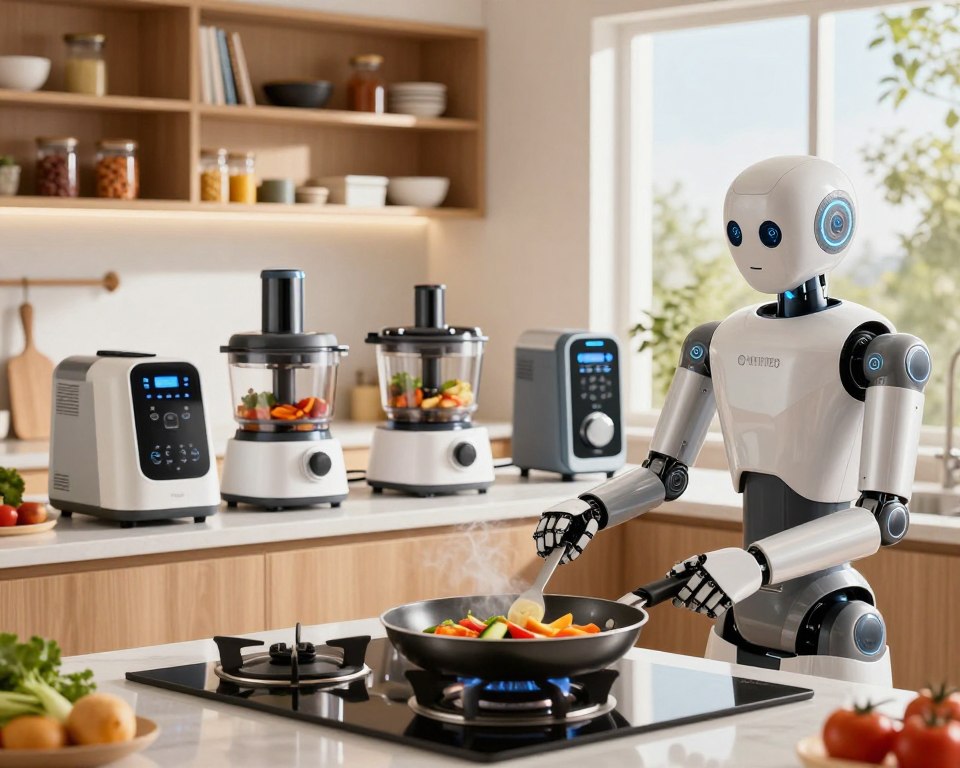
Segmen teknologi memasak dan apa yang diubahnya pada hasil Anda.
Cara panas dialirkan sangat penting: hal itu memengaruhi proses pengcoklatan, waktu pemanasan, dan hasil tekstur.
Konveksi vs pemanasan tradisional: Oven konveksi menggunakan kipas untuk mengalirkan udara, sehingga proses pemerataan dan pengeringan lebih cepat. Oven panggang tradisional mengandalkan panas radiasi dari elemen pemanas dan dapat meninggalkan titik-titik panas yang tidak merata. Oven konveksi seringkali mengurangi waktu memasak dan mengurangi pengulangan proses, sehingga meningkatkan efisiensi dan pengulangan untuk banyak resep.
Injeksi uap: Uap asli menambahkan kelembapan selama proses memasak. Ini menjaga protein tetap juicy dan meningkatkan tekstur serta remah roti. Untuk memasak yang lebih sehat, uap membantu mempertahankan nutrisi dan mengurangi kebutuhan akan tambahan lemak.
Mode memasak hibrida dan multi-fungsi: Kombinasi seperti menggoreng dengan udara + mengukus atau memanggang + membakar memperluas kemampuan satu produk. Mode-mode ini meningkatkan nilai bagi rumah tangga yang sering memasak dengan menggantikan peralatan kecil di atas meja.
| Teknologi | Manfaat utama | Penggunaan terbaik |
|---|---|---|
| Konveksi | Panas merata, waktu lebih cepat | Memanggang, memanggang dengan beberapa rak |
| Injeksi uap | Retensi kelembapan | Roti, protein, pemanasan ulang |
| Mode hibrida | Fleksibilitas | Air fry, grill, combo meals |
Apa yang perlu diverifikasi: Pastikan Anda membedakan uap asli dan uap "bantuan uap", periksa desain kipas, dan baca catatan tentang kinerja kapasitas penuh. Perhatikan juga sensor, preset, dan program terpandu yang mengurangi penyesuaian manual sehingga Anda mendapatkan hasil yang konsisten tanpa perlu menebak-nebak.
Adopsi di sektor perumahan vs komersial: di mana pangsa pasar terbesar berada?
Penggunaan di rumah menjadi pendorong utama penjualan: segmen perumahan memegang sekitar Pangsa pasar 85% pada tahun 2024 dan diperkirakan akan tumbuh sekitar 11,2% CAGR (2025–2034)Konsentrasi tersebut membentuk fitur-fitur yang diprioritaskan oleh produsen untuk dapur sehari-hari.
Mengapa kawasan perumahan mendominasi dan bagaimana fitur-fitur tersebut sesuai dengan rutinitas?
Pembeli rumahan menyukai kendali jarak jauh, kendali suara, dan mode hemat daya karena sesuai dengan ritme harian Anda. Fitur-fitur ini menghemat waktu, mengurangi pengawasan, dan mempermudah memasak secara konsisten tanpa keahlian profesional.
Kasus penggunaan komersial di restoran, toko roti, dan kafe.
Dapur komersial membeli peralatan yang mengutamakan pengulangan dan kapasitas produksi. Restoran, toko roti, dan kafe membutuhkan pengaturan yang dapat diprogram untuk menghasilkan hasil yang identik di seluruh shift dan periode layanan yang sibuk.
Faktor pendorong efisiensi operasional: pengaturan yang dapat diprogram dan konsistensi.
Efisiensi penting di mana pun. Pengaturan awal, program multi-langkah, dan sensor yang andal mengurangi tenaga kerja, meminimalkan kesalahan, dan menurunkan pemborosan. Keuntungan tersebut menjelaskan meningkatnya permintaan komersial dan mengapa banyak fitur profesional kemudian muncul di peralatan rumah tangga konsumen.
“Ketika kontrol kelas profesional tersedia di rumah, Anda mendapatkan hasil yang lebih baik tanpa perlu menyewa koki.”
- Untukmu: Putuskan apakah Anda menginginkan kemampuan komersial penuh atau hanya pengaturan awal dan konsistensi yang meningkatkan masakan sehari-hari.
- Permintaan komersial menandakan fitur mana yang akan menjadi umum dan terjangkau bagi rumah tangga seiring waktu.
Pergeseran saluran distribusi: penjualan online vs offline untuk peralatan dapur
Saluran pembelian mengubah cara Anda meneliti, membandingkan, dan akhirnya membayar peralatan dapur. Perilaku ritel terpecah: banyak konsumen masih menghargai inspeksi langsung, sementara saluran online tumbuh lebih cepat dan mengubah dinamika harga.
Mengapa aktivitas offline masih penting?
Berbelanja secara offline memberikan Anda kepercayaan diri melalui sentuhan langsung. Anda dapat memeriksa kualitas pembuatan, melihat hasil akhir, dan mendapatkan demonstrasi langsung dari staf yang berpengalaman. Untuk peralatan rumah tangga kelas atas, kunjungan ke toko membantu Anda mengajukan pertanyaan tentang pemasangan dan garansi secara langsung.
Mengapa pertumbuhan online lebih cepat?
Segmen daring mencatatkan CAGR sebesar 12,71 TP3T (2025–2034) dibandingkan dengan 10,91 TP3T untuk luring. Daring menawarkan inventaris yang lebih luas, alat perbandingan yang lebih mudah, dan tekanan harga yang lebih tajam di berbagai merek. Penjualan ritel daring AS mencapai 15,91 TP3T pada kuartal pertama tahun 2024, naik 8,61 TP3T dari tahun sebelumnya—data yang menunjukkan pertumbuhan pasar yang nyata, bukan hanya garis tren.
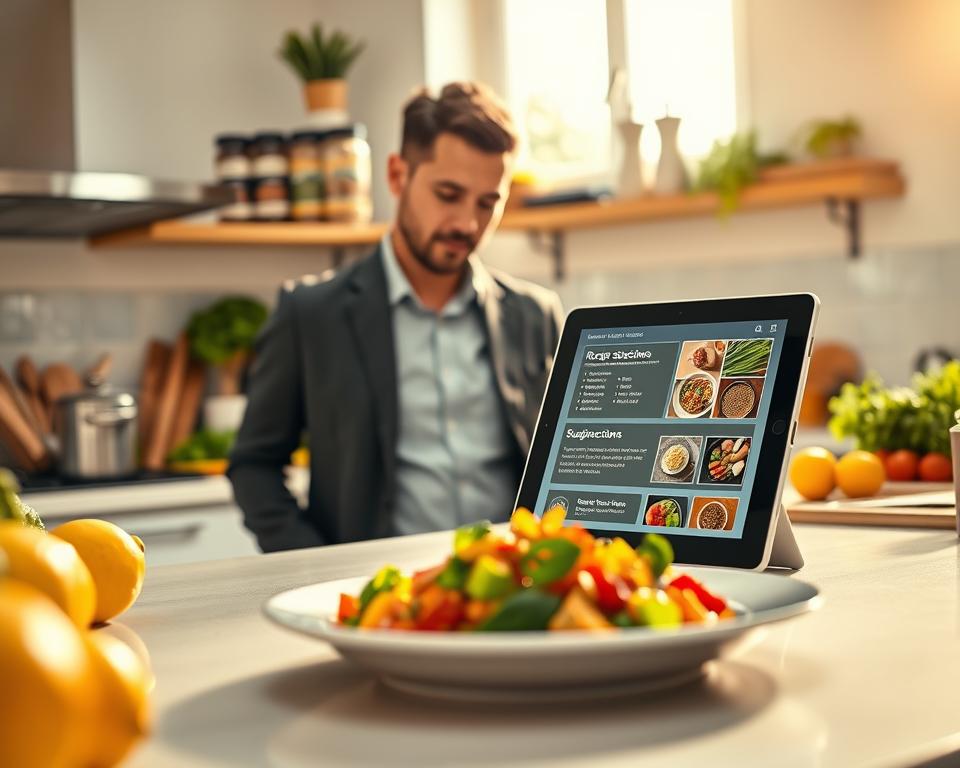
Cara mengevaluasi ulasan, spesifikasi, dan total biaya kepemilikan.
Jangan terpaku pada jargon-jargon pemasaran. Fokuslah pada keandalan aplikasi, garansi dan layanan, serta kinerja memasak yang sebenarnya. Baca banyak ulasan konsumen dan catat masalah yang berulang. Verifikasi spesifikasi terhadap penggunaan nyata—kapasitas, sensor, dan kebijakan pembaruan sangat penting.
“Pilih layanan offline untuk kepastian dan saran langsung; pilih layanan online untuk pilihan dan informasi harga.”
- Periksa total biaya: Biaya pemasangan, aksesori, dan ekosistem seringkali menambah 10–20% pada harga yang tertera.
- Bandingkan garansi dan jaringan layanan sebelum Anda membeli.
- Gunakan kedua saluran tersebut: Lakukan riset online, uji coba offline, lalu beli di tempat yang harga dan dukungannya sesuai dengan toleransi risiko Anda.
Harga dan total biaya kepemilikan: apa yang memengaruhi adopsi?
Biaya sebenarnya dari perangkat yang terhubung jauh melampaui harga yang tertera di toko. Anda harus menambahkan biaya operasional ekosistem, pemeliharaan, dan kemungkinan biaya berlangganan untuk melihat gambaran lengkapnya.
Penentuan kisaran harga dan hambatan keterjangkauan
Pikirkan dalam tiga kategori: pemula, menengah, dan premium. Model pemula memiliki kisaran harga yang lebih rendah tetapi mungkin mengurangi sensor atau konektivitas. Unit kelas menengah menyeimbangkan fitur dan nilai. Produk premium menggabungkan kontrol canggih dan perangkat keras kelas profesional.
Mengapa keterjangkauan harga itu penting: Biaya awal yang tinggi membatasi pilihan konsumen meskipun permintaan dan pertumbuhan pasar meningkat. Banyak rumah tangga ragu-ragu karena pengeluaran awal tersebut bersaing dengan prioritas teknologi rumah lainnya.
Biaya perawatan dan berlangganan di dalam ekosistem rumah pintar
Keputusan pembelian Anda harus mencakup biaya berulang. Konsumen AS rata-rata menghabiskan sekitar USD 3.026 untuk perangkat dan sekitar USD 498 per tahun untuk pemeliharaan, dengan pengeluaran yang direncanakan sekitar USD 896 pada tahun 2025. Angka-angka tersebut menunjukkan bagaimana biaya berkelanjutan membentuk adopsi jangka panjang.
Pantau terus untuk berlangganan: Fitur premium aplikasi, pemantauan jarak jauh, perpustakaan resep, dan garansi tambahan dapat menambah biaya tahunan. Perhatikan detailnya sebelum Anda berlangganan.
Bagaimana para produsen merespons dengan versi yang lebih murah dan nilai yang lebih baik.
Merek-merek mengelompokkan fitur dan meluncurkan model dengan harga lebih rendah untuk memperluas jangkauan pasar. Paket bundling, diskon musiman, dan model generasi sebelumnya sering kali menawarkan perangkat lunak yang stabil dengan harga lebih rendah.
Peluang untuk Anda: Belilah saat ada promosi, pertimbangkan unit bekas yang masih bagus, atau pilih model tahun lalu dengan dukungan firmware yang solid untuk mengurangi total biaya kepemilikan.
“Bandingkan total biaya — bukan hanya harga yang tertera — dan Anda akan menghindari kejutan setelah pembelian.”
- Bandingkan harga di muka, perkiraan biaya perawatan tahunan, dan biaya berlangganan apa pun.
- Periksa ketentuan garansi dan jaringan layanan lokal saat mengevaluasi peralatan.
- Pertimbangkan keterkaitan ekosistem yang dapat menambah biaya atau manfaat di masa depan.
Privasi, keamanan, dan kepercayaan pada oven yang terhubung
Konektivitas online untuk peralatan dapur mengubah kenyamanan rutin menjadi potensi keputusan keamanan. Ketika peralatan Anda terhubung dengan asisten suara dan jaringan rumah, privasi dan keamanan menjadi penting bagi setiap konsumen.
Kekhawatiran umum konsumen terkait perangkat yang saling terhubung
Banyak konsumen khawatir tentang pengumpulan data, pengambilalihan akun, kata sandi yang lemah, dan kebijakan pembaruan yang tidak jelas. Masalah-masalah tersebut memengaruhi bagaimana pasar merespons dan memperlambat keputusan pembelian bagi sebagian rumah tangga.
Kontrol keamanan dan praktik terbaik untuk melindungi dapur pintar Anda.
Periksa: Enkripsi saat transmisi data, pembaruan firmware otomatis, otentikasi multi-faktor, dan pengaturan privasi yang jelas di aplikasi. Kontrol ini menerjemahkan keamanan siber tingkat perusahaan ke dalam hal-hal yang dapat Anda verifikasi sebelum membeli.
Tips praktis: Buat kata sandi yang kuat dan unik, gunakan jaringan tamu terpisah untuk perangkat, perbarui firmware router Anda secara berkala, dan batasi izin aplikasi. Pantau frekuensi pembaruan merek dan dokumentasi dukungan publik sebagai bagian dari evaluasi Anda.
“Kepercayaan seringkali menjadi kunci pertumbuhan pasar yang lebih luas — fitur memang penting, tetapi keamananlah yang memenangkan kepercayaan pembeli.”
Singkatnya, risiko-risiko ini memengaruhi tren pasar. Lakukan pengecekan sederhana di atas dan Anda akan mendapatkan kemudahan tanpa menjadikan dapur Anda sebagai titik lemah dalam rumah pintar.
Gambaran persaingan: pemain kunci, pangsa pasar, dan strategi
Perpaduan antara merek global dan perusahaan khusus kini membentuk fitur mana yang sampai ke konsumen.
Perusahaan-perusahaan terkemuka—Samsung, LG, Bosch, Haier, dan Electrolux—memiliki sekitar Pangsa pasar gabungan 19%Konsentrasi yang rendah tersebut menunjukkan bahwa kategori tersebut terfragmentasi dan terbuka bagi pendatang baru.
Apa yang ditunjukkan oleh persentase tersebut
Pangsa pasar gabungan yang relatif kecil berarti Anda akan melihat perubahan fitur yang cepat. Nama-nama besar berfokus pada skala dan keterkaitan platform, sementara perusahaan yang lebih kecil menguji ide-ide khusus dan titik harga.
Penentuan posisi inovasi dan efisiensi
Samsung memimpin dengan AI dan IoT plus upaya keberlanjutan. LG berfokus pada kontrol aplikasi dan memasak dengan sensor untuk pembeli premium. Haier menargetkan keterjangkauan dan aksesibilitas.
| Perusahaan | Fokus | Apa yang Anda rasakan sebagai pembeli |
|---|---|---|
| Samsung | AI, integrasi platform, efisiensi | Otomatisasi tingkat lanjut, mode ramah lingkungan |
| LG | Kontrol aplikasi, sensor | Preset yang andal, UX premium |
| Haier | Harga yang terjangkau, aksesibilitas | Biaya lebih rendah, lebih sedikit biaya tambahan |
Kemitraan dan perubahan saluran
Kolaborasi memperluas peluang. Misalnya, Savant bermitra dengan Monogram untuk meluncurkan Savant Smart Hearth Oven dan program rujukan untuk integrator. Hubungan ini mendorong integrasi melalui para profesional, bukan hanya pengecer.
“Pilih merek berdasarkan dukungan perangkat lunak, kesesuaian ekosistem, dan keandalan jangka panjang.”
Kesimpulan bagi pembeli: Evaluasi perusahaan berdasarkan pembaruan firmware, jaringan layanan, dan kompatibilitas ekosistem. Untuk konteks pasar yang lebih mendalam, lihat laporan pasar oven pintar.
Berita industri dan peluncuran produk yang membentuk adopsi saat ini
Peluncuran produk terbaru mengungkapkan prioritas yang jelas: kecepatan, kontrol tekstur, dan memasak secara paralel.
Peluncuran terbaru dan apa yang diungkapkannya tentang prioritas fitur.
Para produsen mengirimkan produk yang menggabungkan berbagai kemampuan dalam satu unit. Model meja dapur GE Profile (Maret 2023) mendorong Pemanasan Awal Nol Sebagai solusi praktis dan hemat energi. Model Combi Samsung (Juli 2024) menggabungkan penggorengan udara + kukus dan menambahkan proses fermentasi/pengembangan adonan untuk alur kerja makanan yang lebih luas.
Alto-Shaam (Feb 2024) memamerkan perangkat multi-ruang dengan kontrol kelembaban independen. Bosch (Des 2024) membuka Siemens Experience Centre untuk memungkinkan pembeli menguji kasus penggunaan nyata sebelum mereka membeli.
Fitur-fitur tersebut memberi sinyal yang mengubah permintaan dan pilihan pembelian.
Mengapa suhu nol derajat sebelum pemanasan itu penting: Hal ini memangkas total waktu memasak, menghemat energi, dan mengurangi waktu yang dihabiskan untuk proses memasak langsung. Bagi rumah tangga yang sibuk, kecepatan tersebut secara langsung berdampak pada peningkatan kebutuhan.
Menggoreng dengan udara + mengukus Ini menandakan tren kesehatan dan tekstur. Kombinasi antara kerenyahan dan pengendalian kelembapan mengurangi kebutuhan akan peralatan tambahan dan mendukung hasil masakan yang lebih sehat.
Mode fermentasi/pengembangan adonan memperluas kemampuan unit ini di luar sekadar menyiapkan makan malam. Anda dapat mengembangkan adonan roti, membuat yogurt, dan menjalankan siklus persiapan makanan yang telah direncanakan tanpa peralatan tambahan.
Desain multi-ruang membuktikan bahwa memasak secara paralel benar-benar bermanfaat. Menjalankan tiga siklus independen sekaligus memungkinkan Anda memasak hidangan berbeda dengan kelembapan dan waktu yang berbeda — ideal untuk menjamu tamu atau menyiapkan makanan dalam jumlah besar.
“Peluncuran terbaru menunjukkan bahwa merek-merek ingin mengganti perangkat sekali pakai dengan alat masak serbaguna yang terpandu.”
- Apa yang dimaksud dengan dewasa: Pemanasan awal nol dan penggorengan udara + uap banyak tersedia dan praktis saat ini.
- Apa yang premium: Sistem multi-ruang dan kontrol kelembaban tingkat lanjut memang ampuh, tetapi harganya masih tergolong mahal.
- Kesimpulannya: Prioritaskan fitur yang sesuai dengan masakan harian Anda. Jika kecepatan dan jumlah peralatan yang lebih sedikit penting, cari fitur tanpa pemanasan awal dan mode kombinasi. Jika Anda sering menjamu tamu, pertimbangkan fitur multi-ruang atau kontrol kelembapan kelas profesional.
Kesimpulan
Seiring perkembangan kategori ini, dapur rumah tangga semakin memiliki lebih banyak pilihan dan sinyal nilai yang lebih jelas. Data global (USD 317,2 juta pada tahun 2024 hingga USD 918,2 juta pada tahun 2034 dengan CAGR 11,31% per 3 triliun dolar AS) menunjukkan pertumbuhan yang stabil dan ketersediaan yang lebih luas.
Mengapa bertindak sekarang? Kenyamanan, efisiensi, mode kesehatan, dan kontrol aplikasi memberikan keuntungan nyata setiap hari. Kepemimpinan AS di Amerika Utara (pangsa pasar 77%) mempercepat inovasi dan memperluas pilihan yang dapat Anda beli dan layani secara lokal.
Bandingkan wilayah secara singkat: Eropa dan Asia Pasifik menunjukkan momentum yang serupa, dan Timur Tengah berkembang dengan inisiatif kota pintar. Gunakan analisis ini untuk memilih segmen yang tepat—terintegrasi, di atas meja, atau berdiri sendiri—dan untuk memprioritaskan fitur, konektivitas, dan keamanan.
Daftar periksa cepat: Ukur ruang Anda, petakan kebutuhan memasak Anda, periksa keandalan jaringan, bandingkan merek, dan atur waktu pembelian saat ada diskon. Perhitungkan harga, perawatan, dan biaya ekosistem agar oven baru Anda dapat digunakan selama bertahun-tahun.